Google’s Performance Max channel timeline update — rolled out across accounts in early 2026 — has given advertisers something they never had before: a clear visual map of how ad spend shifts between channels over time, and which channels are generating post-click conversions versus which ones are silently draining budget.
For social advertisers who also run Google campaigns, this data is a wake-up call. For post-click optimization, it reveals a diagnostic framework that applies across every channel and platform you run.
→ If you’re already looking for a fix, Book a Free Demo and our team will audit your post-click funnel for free.
How PMax’s Channel Timeline Exposes Conversion Drop-Off
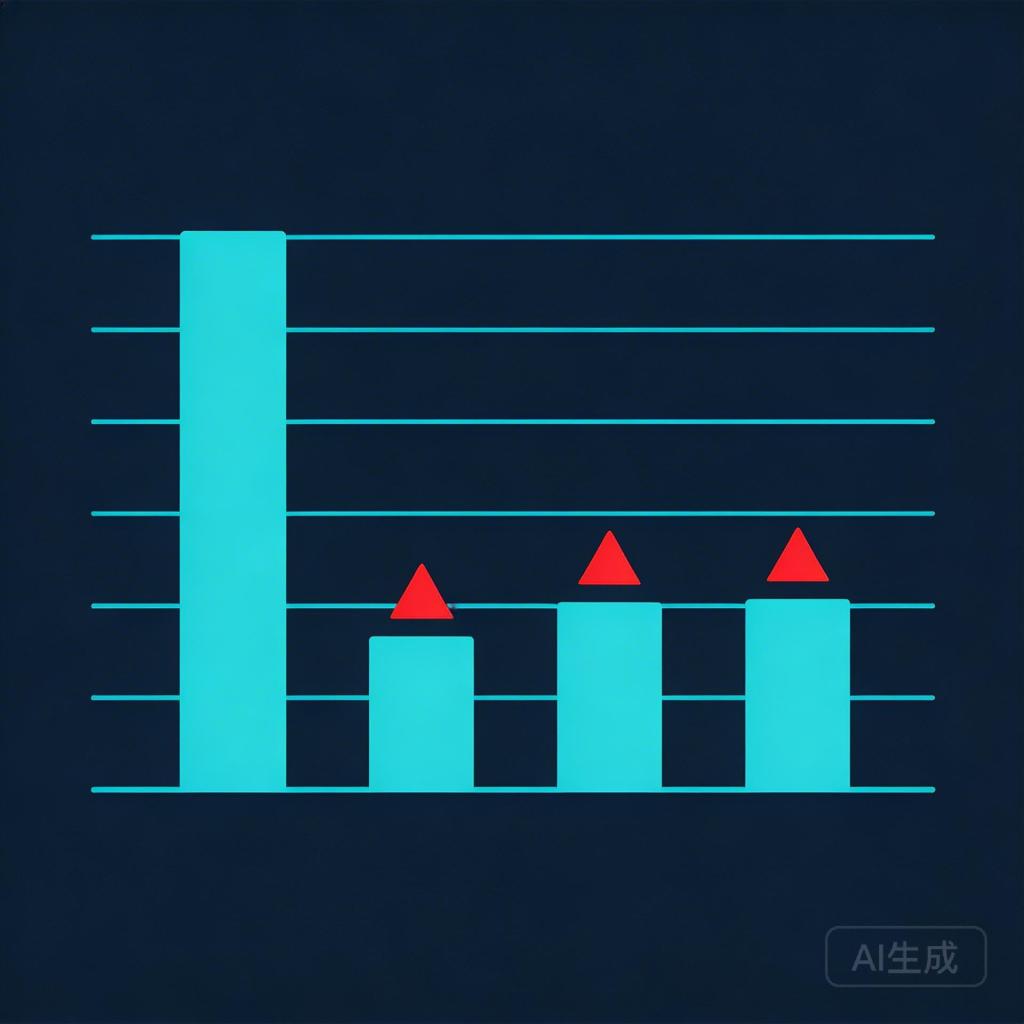
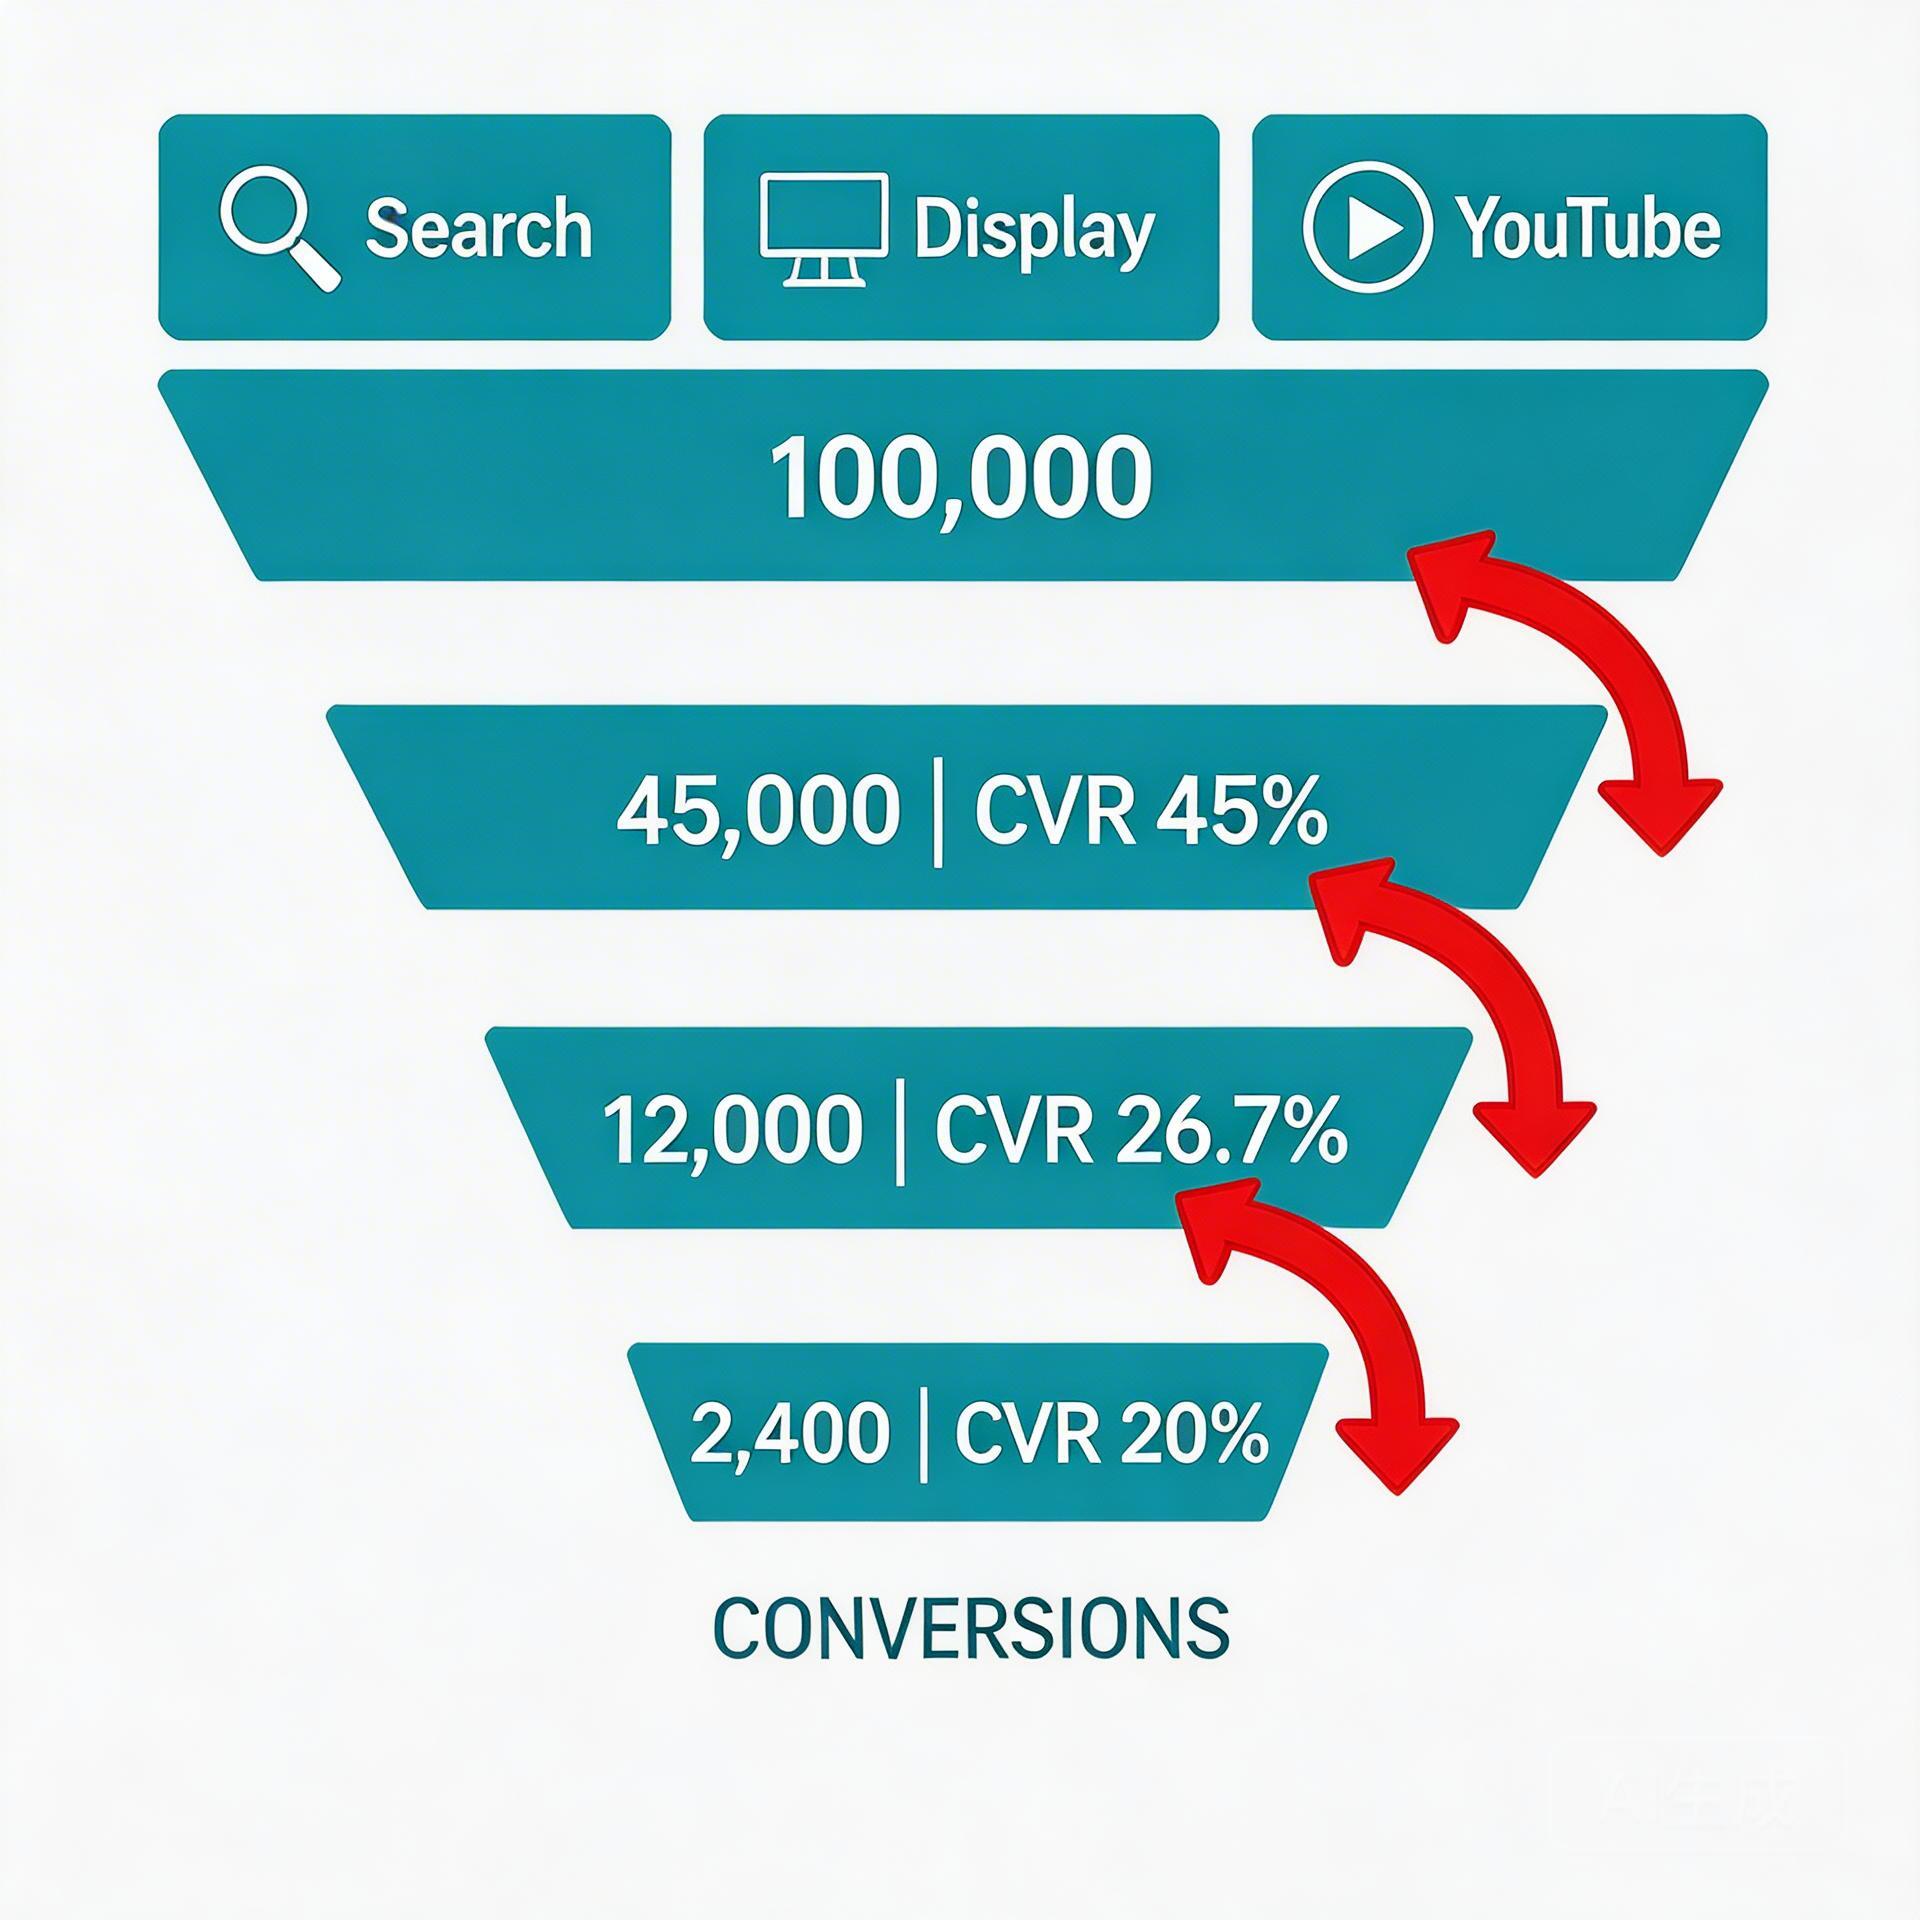
The channel timeline shows advertisers a week-by-week view of budget allocation across PMax’s channels: Search, Shopping, Display, YouTube, Gmail, Maps, and Discover. Alongside this allocation view is performance data — and the CVR differences are stark.
Campaigns analyzed across verticals in 2026 show consistent patterns:
- Search and Shopping: CVR typically 3–5% for intent-matched campaigns
- Display and Discover: CVR typically 0.5–1.5% — but consuming 35–55% of budget
- YouTube: CVR varies heavily by ad format, but often below 1% for conversion campaigns without post-click optimization
The critical insight: PMax’s AI is optimizing for conversions at the campaign level — but it cannot differentiate between a conversion that came after a 30-second, high-intent engagement and one that came after a 3-second accidental click. The post-click experience is entirely outside PMax’s control. That’s where your CVR gap lives.
The Four Signs Your Campaign Has a Channel-Level Drop-Off Problem
Most teams don’t realize they have a channel-level CVR problem until they break their data down beyond campaign averages. Here are four diagnostic indicators:
Sign 1: Your Campaign CVR Is Flat Despite Increasing Budget
If you’ve scaled budget and your overall CVR hasn’t moved (or declined), you’re likely subsidizing low-intent channel clicks with high-intent channel budget. As PMax scales, it naturally increases spend in broader reach channels (Display, YouTube) — which have lower intent and higher bounce rates at the same landing pages.
Sign 2: Your Bounce Rate Is High But Click Quality Looks Good
A high bounce rate on your landing page — despite good ad relevance scores and CTR — is a classic sign of post-click mismatch. Users are clicking (the ad works) but leaving immediately (the landing page doesn’t match what they expected). This is a channel-level diagnostic: find which source has the highest bounce rate, and you’ve found your biggest CVR optimization opportunity.
Sign 3: Your CPA Is Rising Without a Change in Bid Strategy
Rising CPA without a bid change usually means one of two things: auction competition increased, or your conversion rate dropped. If it’s the latter, and your ads are still generating clicks, the problem is almost certainly post-click. PMax’s AI will start pulling budget from underperforming channels eventually — but by the time the algorithm adjusts, you’ve already spent inefficiently for weeks.
Sign 4: Your Channel Mix Shows High Display/YouTube but Low ROAS
Open your PMax channel breakdown. If Display or YouTube is consuming more than 40% of your spend but your overall ROAS is below target, you have a clear signal: these channels are generating clicks that aren’t converting. The fix is post-click optimization for these specific channels, not bid adjustments.
Step-by-Step: Diagnosing and Fixing Channel-Level Drop-Off
Step 1: Build a Channel-Level CVR Report
In Google Ads, use the “Campaign” tab with “Segment by Network” to get CVR broken down by channel. Export this data to a spreadsheet and calculate the gap between your best-performing channel (usually Search) and your worst (usually Display). This gap is your CVR optimization opportunity in dollar terms — multiply the gap percentage by your Display spend to see the potential recovery.
Step 2: Set Up Channel-Specific UTM Tracking
Ensure all your PMax campaigns have UTM parameters set at the channel level. In GA4, use the Source/Medium report to see post-click behavior (bounce rate, session duration, pages per session) broken down by channel. This gives you the post-click data that Google Ads doesn’t natively show.
Step 3: Create Intent-Matched Landing Pages by Channel Type
Don’t send all channels to the same landing page. Build a minimum of two variants:
- High-intent variant (for Search/Shopping): Direct conversion focus, product/service above the fold, strong social proof, single CTA
- Low-intent variant (for Display/YouTube/Gmail): Problem-first framing, educational hook, softer CTA (demo, free trial, email capture)
For gaming and AI social app campaigns, this means your Search traffic (users actively looking for your app category) gets a direct install CTA, while your Display traffic (users who saw your banner while reading something else) gets a “see how it works” intro page with a lower-friction entry point.
Step 4: Implement Post-Click Re-Engagement for Display/YouTube Traffic
Display and YouTube generate a large pool of users who have seen your brand and clicked — but didn’t convert on the first visit. These users are warm, not cold. An automated re-engagement sequence triggered within 24–48 hours (based on behavioral signals: time on page, scroll depth, page exit) can recover 15–25% of these users at a fraction of the cost of acquiring new clicks.
This is distinct from standard retargeting. Re-engagement targets post-click behavioral signals, not just cookie-based audience membership. It’s the mechanism that turns low-intent channel traffic from a budget drain into a recoverable conversion pool.
For the complete technical breakdown of post-click funnel architecture, see our guide on Facebook Ads Conversion Rate Optimization. For channel-specific post-click experience design, the framework in Facebook Ads Post-Click Experience: 5 Steps to Boost CVR walks through the exact page design decisions that move CVR by 2–3 percentage points.
The ROI of Fixing Channel-Level Drop-Off
Here’s the math that makes channel-level CVR optimization worth prioritizing over other campaign changes:
If your PMax campaign spends $10,000/month and 45% goes to Display ($4,500), with a Display CVR of 0.8% vs. your Search CVR of 3.5%, you’re generating roughly 36 conversions from Display at a CPA of $125. If you can improve Display CVR to 1.8% (still well below Search, but achievable with intent-matched landing pages and re-engagement), you generate 81 conversions from the same $4,500 — reducing CPA to $55.60. That’s a $2,500+ monthly recovery from one channel optimization change.
At scale, these numbers compound. Teams that implement systematic channel-level post-click optimization — including automated re-engagement for low-intent traffic — consistently report 20–35% overall campaign CVR improvement within 90 days.
Summary: Channel Drop-Off Diagnosis in Five Questions
Run through these five questions about your current campaigns:
- Do you know your CVR by channel (not just campaign average)?
- Do you have separate landing pages for high-intent vs. low-intent channels?
- Do you track post-click behavior (bounce rate, session duration) by traffic source?
- Do you have re-engagement automation for Display/YouTube visitors who didn’t convert?
- Do you review channel CVR monthly and adjust your post-click strategy accordingly?
If you answered “no” to three or more, you have a systematic channel-level CVR problem — and significant recoverable budget sitting in your current campaigns.
Stop losing conversions after the click.
DeepClick helps Meta advertisers fix post-click drop-offs and improve CVR by 30%+ through automated re-engagement and post-click link optimization.

留下评论