Google Performance Max is supposed to make channel management easier by automating everything. But when your campaigns show reasonable aggregate CPA and you still can’t figure out where your budget is actually working, you have a visibility problem. Channel-level CVR tracking in PMax is the missing layer most advertisers skip—and it’s why so many PMax campaigns look fine on the surface while quietly underperforming.
→ If you’re already looking for a fix, Book a Free Demo and our team will audit your post-click funnel for free.
The Channel Visibility Gap in Performance Max
Performance Max consolidates six Google channels into one campaign: Search, Shopping, Display, YouTube, Discover, and Gmail. The campaign-level metrics Google shows you are blended averages across all six. This is convenient for reporting but catastrophic for optimization.
Here’s what the blended view hides: In a typical PMax campaign, Search network traffic converts at 3-6% while Display network traffic converts at 0.3-0.8%. If your campaign drives 70% of volume from Display (common in PMax), your aggregate CVR of 1.2% might look acceptable—while your Search traffic is converting at 5% and your Display traffic is dragging the number down with near-zero efficiency.
You’re paying search-equivalent CPCs for display-quality conversions without knowing it.
How to Extract Channel-Level CVR Data From PMax
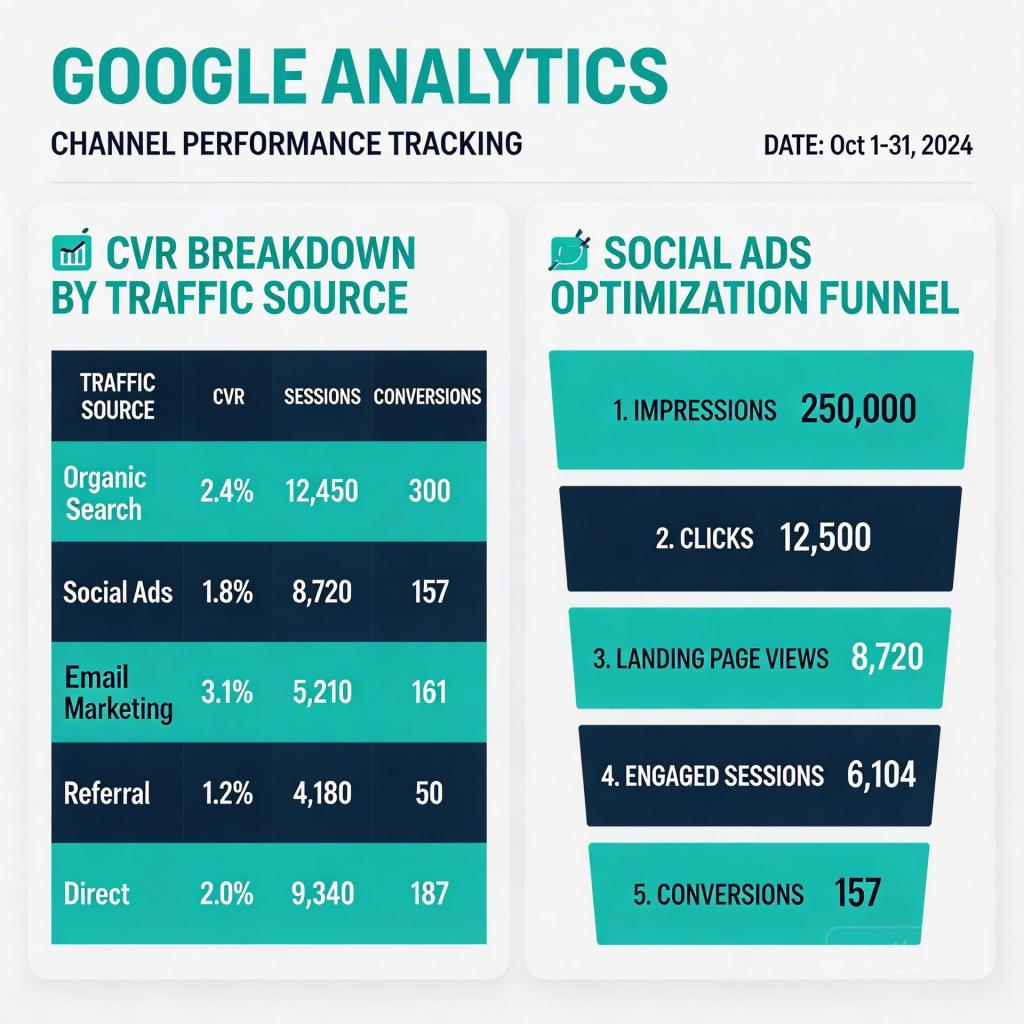
Method 1: Google Analytics 4 Session Segmentation
PMax passes channel data to GA4 when you have auto-tagging enabled and your GA4 property is properly linked. To extract channel-level CVR:
- In GA4, go to Reports → Acquisition → Traffic Acquisition
- Set the primary dimension to Session source / medium
- Add the secondary dimension Session campaign and filter for your PMax campaign name
- Add the Key event rate (conversion rate) metric
You’ll now see CVR by channel for each PMax campaign. Typical findings: Google / cpc (Search) converts 4-8x better than display / cpm (Display Network).
Method 2: UTM Parameter Tracking by Asset Group
For more granular control, add UTM parameters directly to your PMax landing page URLs within each asset group:
- Asset Group A (Search-focused):
?utm_source=google&utm_medium=cpc&utm_campaign=pmax&utm_content=search-ag - Asset Group B (Display/YouTube):
?utm_source=google&utm_medium=display&utm_campaign=pmax&utm_content=display-ag
This lets you track not just channel performance but asset group performance at the conversion level—critical for understanding which creative and audience combinations are actually generating CVR.
Method 3: Impression Share vs. Conversion Rate Correlation
In Google Ads, use the Auction Insights report for your PMax campaign and cross-reference it with the Combinations report (found under Insights tab). High impression share in your Combinations report with low conversion events indicates creative-to-audience mismatch—a CVR problem at the asset level, not just the channel level.
What You’ll Find: The Three CVR Culprits
Culprit 1: Display Network Over-allocation
PMax’s algorithm often allocates disproportionate budget to Display because Display inventory is cheaper per impression, which makes the algorithm’s efficiency signal look better in the short term. But Display traffic typically converts 5-10x worse than Search traffic.
Fix: Add audience signals that strongly favor high-intent users (customer match lists, website visitor segments with 30-day lookback). This steers the algorithm toward quality over quantity.
Culprit 2: Landing Page CVR Not Feeding Back Into Algorithm
PMax optimizes on the conversion events you’ve set up in Google Ads. If your primary conversion event is “page view” or “session duration,” you’re teaching the algorithm to optimize for engagement rather than actual business outcomes.
Fix: Set your primary conversion action to a specific, high-value event: form submission, purchase, app install. Set “page view” as a secondary conversion for modeling only. This is the foundation for accurate CVR tracking that the algorithm can act on.
For teams running parallel campaigns on Meta and Google, this is where cross-channel CVR benchmarking becomes valuable—comparing what you’re seeing in PMax against your Meta post-click performance reveals whether you have a channel problem or a landing page problem.
Culprit 3: Asset Group CVR Variance
A single PMax campaign can contain multiple asset groups, each with different headlines, descriptions, images, and audiences. Asset groups with weak creative or poorly matched audiences generate impressions but not conversions—dragging your campaign CVR down while consuming budget.
Review the “Asset Group” performance tab monthly. Pause asset groups with impression share above 20% and conversion rate below 50% of your campaign average. Reallocate budget to your top-performing asset groups before creating new ones.
Building a CVR Tracking Dashboard for PMax
Set up a Looker Studio (Google Data Studio) dashboard that combines:
- Google Ads data: Campaign spend, impressions, clicks, conversions, CPA by campaign
- GA4 data: Session CVR by source/medium (channel), landing page performance, bounce rate by landing page
- Custom blend: Cost per session (from Ads) × session CVR (from GA4) = effective cost per conversion by channel
Update this weekly. The channels where your “effective cost per conversion” is 2x+ your campaign average are your optimization targets. The channels where it’s 50% below average are where you should be pushing for more budget allocation.
Post-Click Optimization as the CVR Multiplier
Once you have channel-level CVR data, you can make targeted improvements:
- Search traffic CVR below 3%? The problem is landing page message-match. Audit whether your PMax ad copy aligns with what users find when they land on your page.
- Display traffic CVR below 0.5%? Normal. Consider whether display is worth running at all, or whether tighter audience signals can improve it to 0.8-1%.
- YouTube CVR declining? The creative is fatiguing. Rotate new video assets every 4-6 weeks. YouTube viewers lose attention after 3 seconds—the first 3 seconds of your video asset are the entire campaign for that channel.
The brands making PMax work in 2026 are the ones treating post-click performance as a separate optimization layer from ad delivery. As we’ve seen with post-click experience optimization, the biggest CVR gains rarely come from changing the ad—they come from fixing what happens after the click.
The PMax CVR Tracking Checklist
- ☑ GA4 linked to Google Ads with auto-tagging enabled
- ☑ Primary conversion event set to high-value action (not page view)
- ☑ UTM parameters on landing page URLs per asset group
- ☑ Weekly channel CVR review in GA4 Traffic Acquisition report
- ☑ Asset group performance audit monthly (pause underperformers)
- ☑ Looker Studio dashboard combining Ads + GA4 channel CVR data
- ☑ Landing page variants created for Search vs. Display traffic
PMax gives you scale. Channel-level CVR tracking gives you the intelligence to make that scale profitable.
Stop losing conversions after the click.
DeepClick helps Meta advertisers fix post-click drop-offs and improve CVR by 30%+ through automated re-engagement and post-click link optimization.

留下评论