If you are running Google Performance Max campaigns in 2026, your budget is flowing across Search, Display, YouTube, Discover, Gmail, and Maps simultaneously — but the post-click conversion rates on each channel can differ by 3-5x. The problem is not your ad creative or your bidding strategy. It is that PMax treats all channels as one black box, while your landing pages and post-click funnels perform radically differently depending on where the traffic originates. In this guide, we break down the PMax channel CVR gap, explain why it bleeds your ROAS, and give you a concrete playbook to fix post-click optimization across every channel Google sends you traffic from.
→ Curious how return links work? See DeepClick in 1 minute — no review required, more impressions per click.
The PMax Black Box Problem: One Campaign, Six Channels, Wildly Different CVR
Google Performance Max was designed to simplify multi-channel advertising by letting Google’s AI allocate budget across its entire inventory. In theory, this sounds efficient. In practice, it creates a critical blind spot: advertisers lose visibility into which channels are actually converting after the click.
PMax distributes your spend across six primary channels:
- Search — High-intent queries where users actively seek solutions
- Display Network — Banner placements across millions of third-party websites
- YouTube — Video ads in pre-roll, mid-roll, and discovery placements
- Discover — Native feed ads in Google’s content recommendation engine
- Gmail — Sponsored messages in the Promotions tab
- Maps — Local inventory and service ads tied to geographic searches
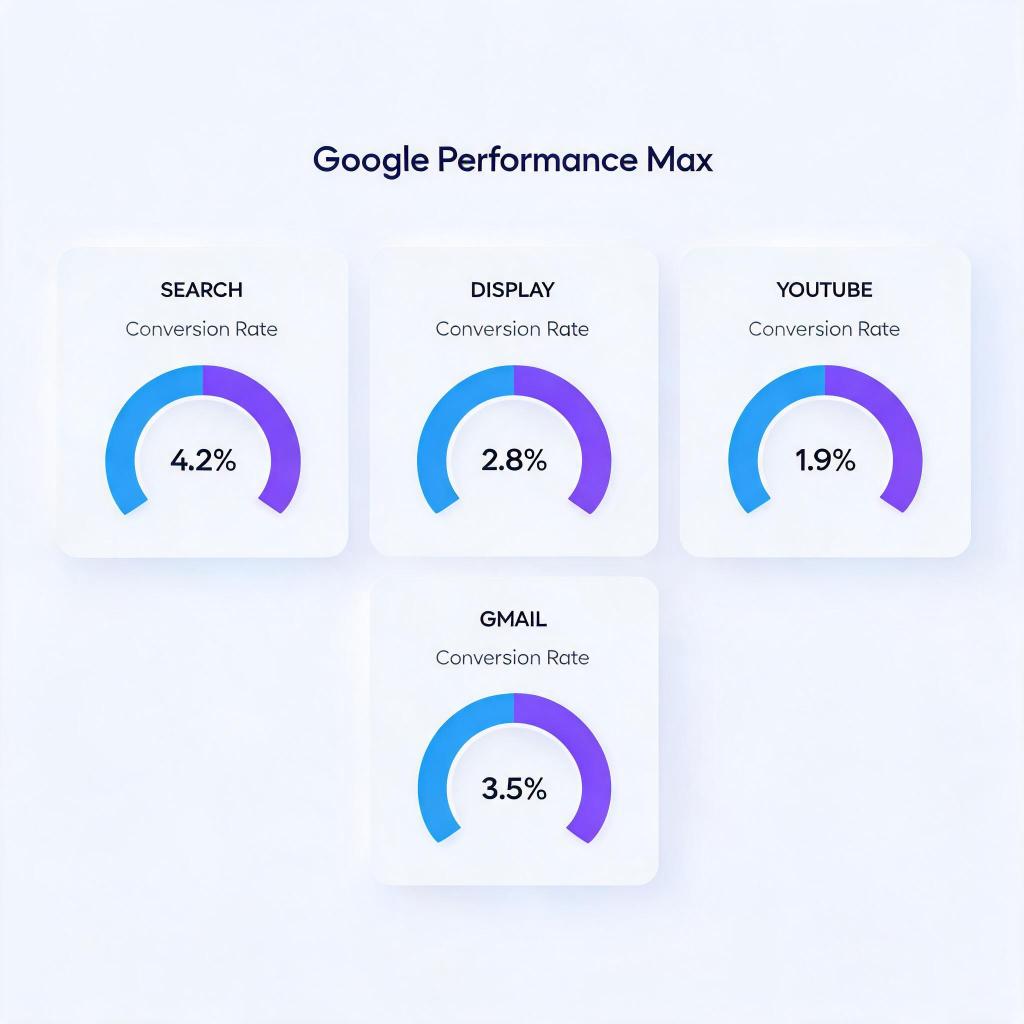
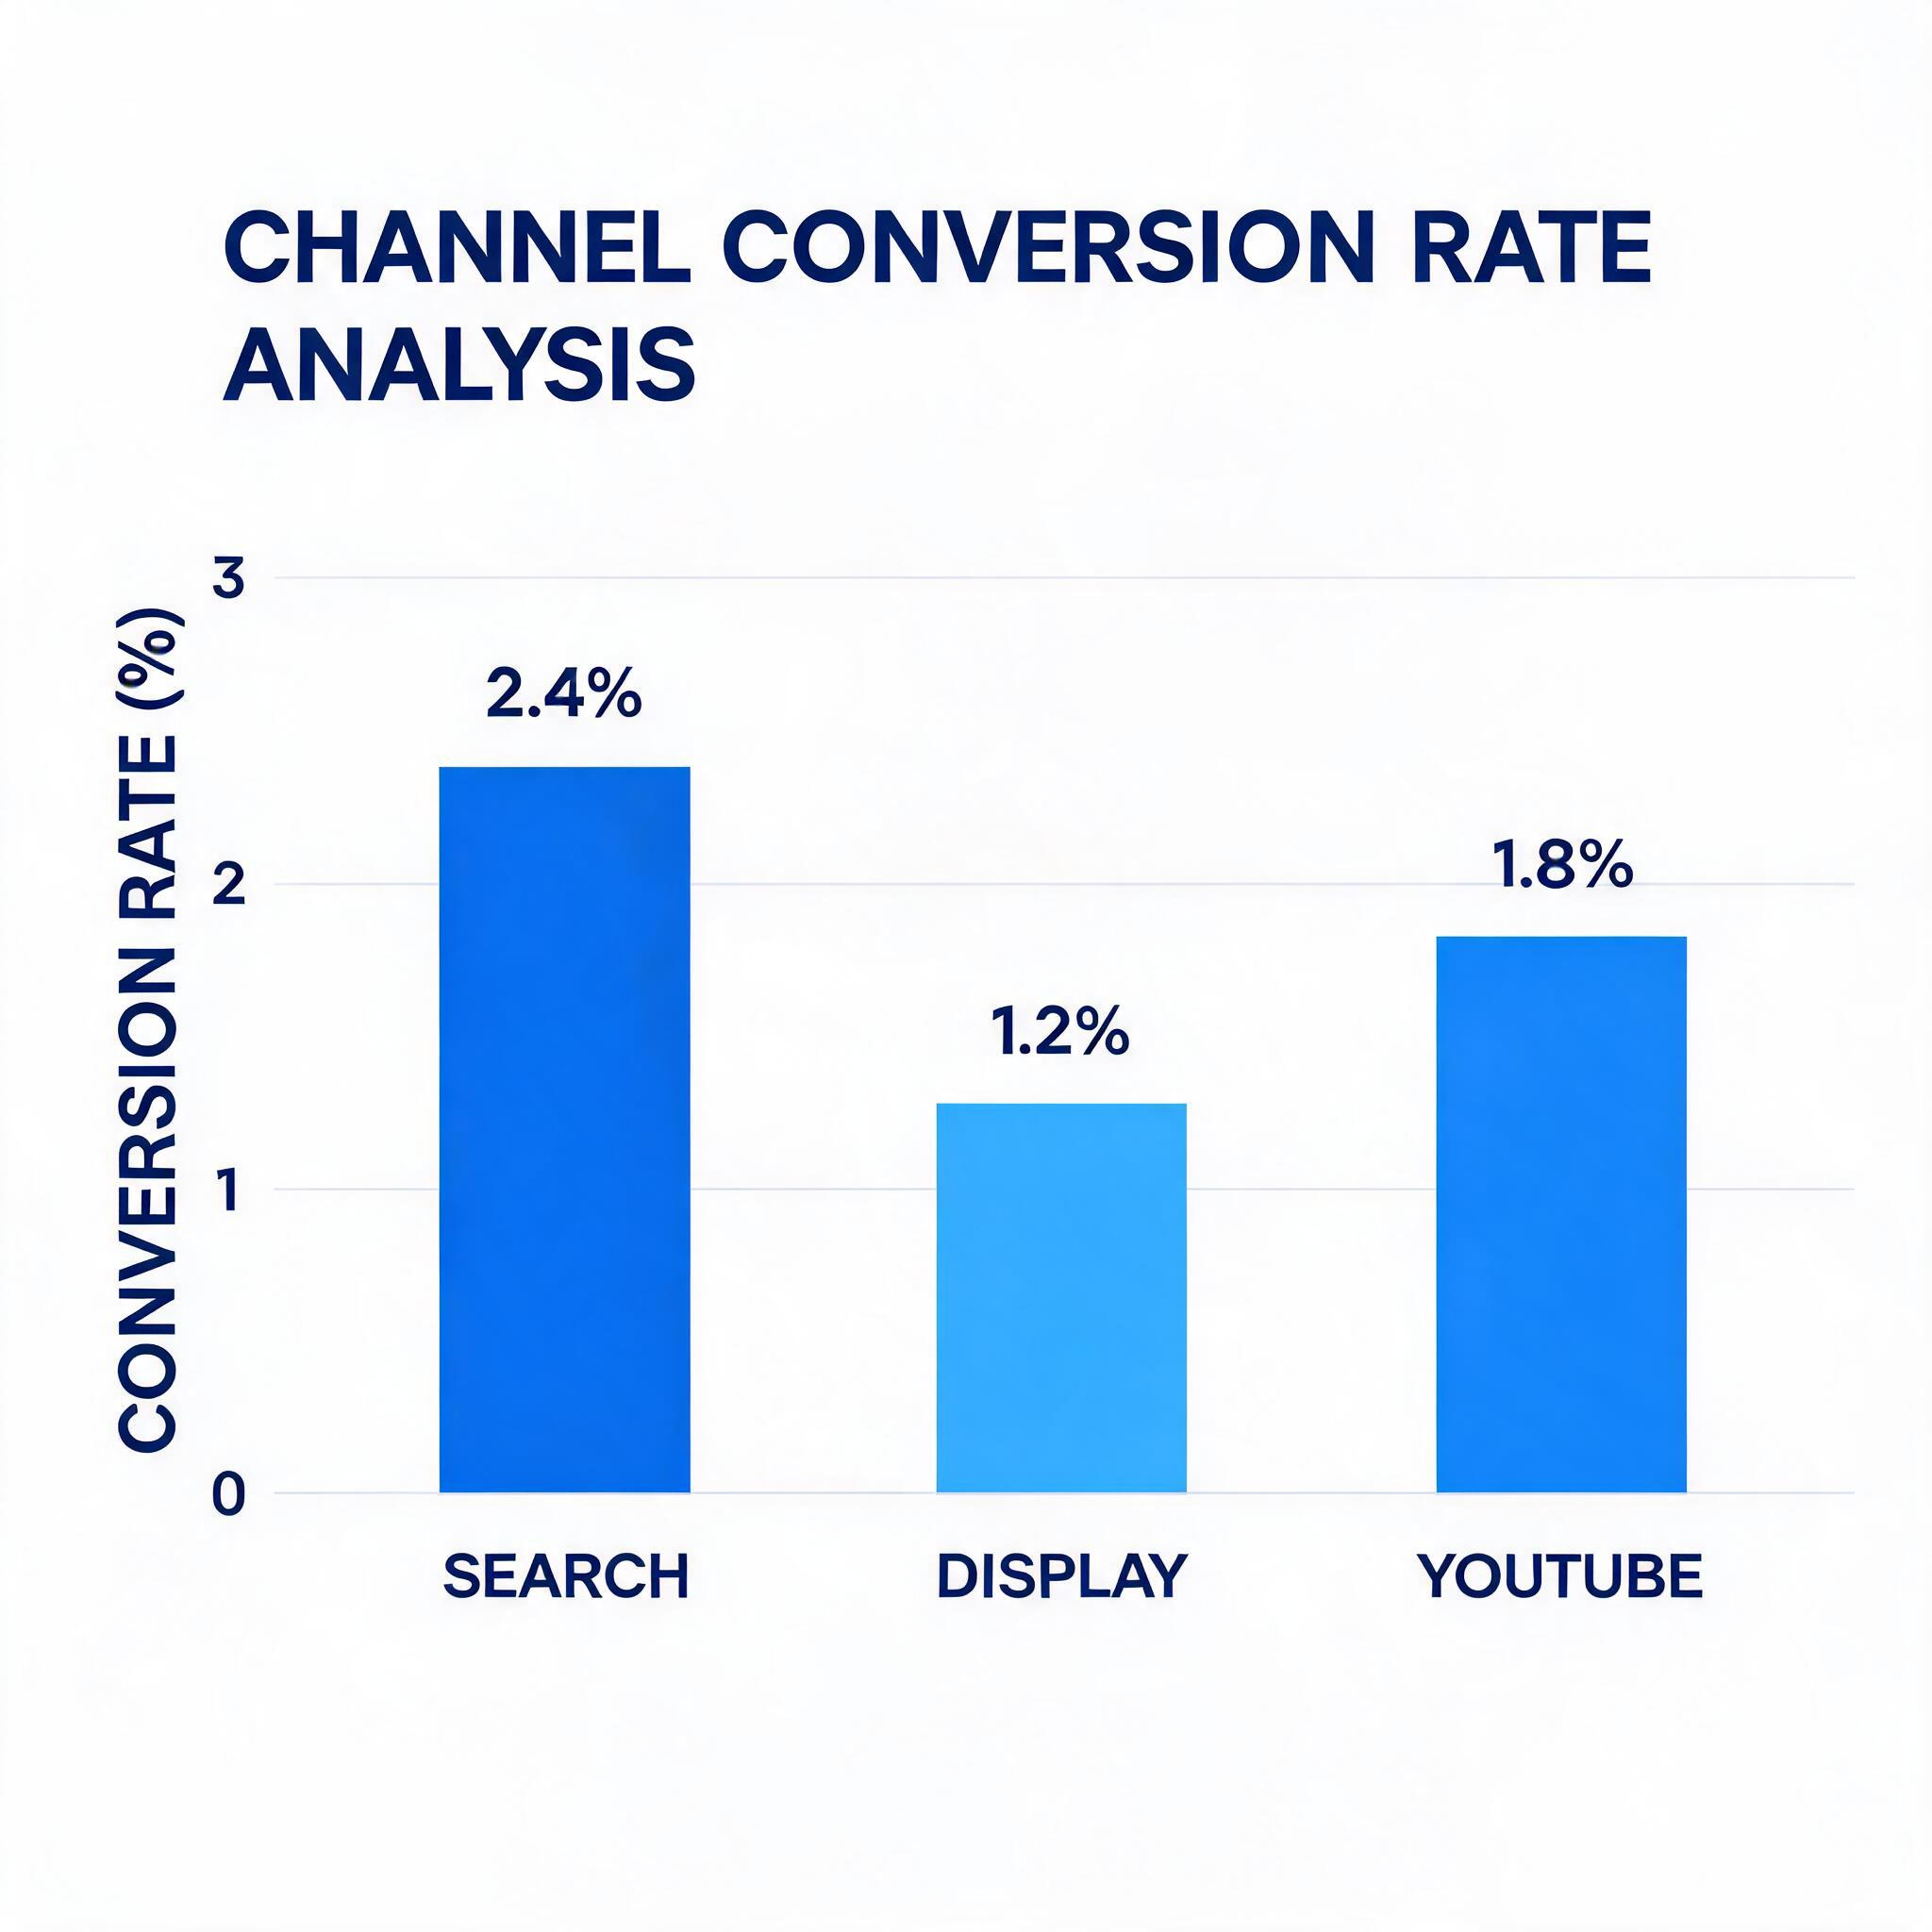
According to a 2025 analysis by Search Engine Land, the average post-click conversion rate for Search traffic within PMax campaigns is 4.2%, while Display traffic averages just 0.8%. YouTube falls somewhere in between at 1.4%, and Discover hovers around 1.1%. That means your Search clicks are converting at over 5x the rate of your Display clicks — yet PMax may be sending 40-60% of your budget to Display simply because CPCs are cheaper there.
The fundamental issue is that Google’s algorithm optimizes for conversions at the campaign level, not for post-click conversion efficiency per channel. If Display delivers a large volume of cheap clicks that occasionally convert, PMax’s AI may favor it over Search, where clicks cost more but convert at dramatically higher rates. This is especially problematic for advertisers in SaaS, e-commerce, and app verticals where conversion rate optimization across ad platforms is essential to profitability.
The opacity compounds the problem. Google provides limited channel-level reporting within PMax. You can see asset group performance and some placement data, but granular CVR breakdowns per channel require manual URL tagging, third-party analytics integration, or specialized tools. Most advertisers never bother — and their budgets bleed quietly as a result.
Even within a single channel, performance is not uniform. A YouTube in-stream ad that interrupts a cooking tutorial and a YouTube Shorts ad that appears between vertical clips create vastly different user mindsets by the time someone reaches your landing page. PMax’s consolidated reporting obscures all of this nuance, forcing advertisers to optimize blind.
Why Channel-Level CVR Gaps Destroy Your ROAS (The Data)
The post-click conversion gap between PMax channels is not a minor reporting inconvenience — it directly erodes your return on ad spend. Here is why the numbers matter more than most advertisers realize.
The Math Behind Wasted Spend
Consider a PMax campaign spending $10,000 per month. If Google allocates 50% to Display (CVR 0.8%) and 50% to Search (CVR 4.2%), you would get:
- Display: $5,000 spend → approximately 6,250 clicks at $0.80 CPC → 50 conversions
- Search: $5,000 spend → approximately 1,667 clicks at $3.00 CPC → 70 conversions
- Total: 120 conversions at $83.33 CPA
Now imagine you could shift just 20% of the Display budget to Search:
- Display: $4,000 spend → approximately 5,000 clicks → 40 conversions
- Search: $6,000 spend → approximately 2,000 clicks → 84 conversions
- Total: 124 conversions at $80.65 CPA
That is a 3.3% improvement in conversions and a 3.2% reduction in CPA — from a single budget reallocation. Scale this to six-figure monthly budgets and the impact compounds to tens of thousands of dollars in recovered spend per quarter.
Post-Click User Behavior Varies Dramatically by Channel
Research from Contentsquare’s 2025 Digital Experience Benchmark shows that user behavior after the click differs substantially by traffic source:
- Search traffic has an average session duration of 2 minutes 14 seconds and a bounce rate of 38%
- Display traffic averages just 42 seconds with a bounce rate of 68%
- YouTube referral traffic sits at 1 minute 8 seconds with a 55% bounce rate
- Discover and feed traffic averages 51 seconds with a 62% bounce rate
These behavioral differences mean a single landing page cannot perform equally well for all PMax channels. A user arriving from a Search query has explicit intent and expects immediate, relevant information. A user arriving from a YouTube pre-roll ad was interrupted mid-video and needs a fundamentally different persuasion journey. A Gmail Promotions user was browsing emails with no purchase intent at all. Sending all three to the same page is a conversion killer.
Wordstream’s 2025 Google Ads benchmark confirms this pattern at scale: across 18,000 Google Ads accounts, campaigns that segmented post-click experiences by traffic source achieved 22% higher conversion rates on average compared to those using a single landing page for all placements.
The Attribution Distortion Effect
PMax’s automated attribution also creates a feedback loop that worsens the problem. When a Display impression contributes to a view-through conversion that is later completed via a branded Search click, PMax may credit the Display channel — reinforcing the algorithm’s preference for cheap Display impressions. Wordstream’s 2025 PMax benchmark found that up to 30% of PMax-reported conversions involve view-through attribution from Display or YouTube, which inflates the perceived CVR of those channels.
This distortion is similar to challenges seen in post-click tracking accuracy across ad platforms, where attribution models can obscure true conversion paths. Without channel-level CVR clarity, you are optimizing on unreliable data — and the algorithm learns the wrong lessons from every conversion event.
The compounding effect is real. Inflated Display CVR leads PMax to allocate more budget to Display, which generates more view-through “conversions,” which further inflates Display CVR in the reporting. This cycle can consume 30-50% of campaign budget on low-intent channels while the advertiser sees only a steady stream of “conversions” in their dashboard.
How to Fix PMax Post-Click Optimization: A Channel-by-Channel Playbook
Fixing the PMax channel CVR problem requires a three-pronged approach: gain visibility into channel-level performance, build channel-specific post-click experiences, and implement systematic testing to continuously improve. Here are the concrete steps.
Solution 1: Implement Channel-Level Tracking with UTM Parameters and GA4 Segments
PMax does not natively break down CVR by channel in a way most advertisers find useful. You need to build your own tracking layer:
- Use final URL expansion with custom parameters. In your PMax campaign settings, append tracking parameters that capture the placement type. While PMax does not allow traditional UTM_source overrides per channel, you can use Google’s
{placement}and{network}ValueTrack parameters in your tracking template to identify where each click originates. Set up your tracking template as:{lpurl}?pmax_network={network}&pmax_placement={placement}. This gives you the raw data you need to segment post-click behavior. - Create GA4 exploration reports segmented by landing page and source. Build a custom exploration in GA4 that segments sessions by the
session_source/session_mediumdimensions, filtered to your PMax campaign. Cross-reference this with conversion events to calculate true post-click CVR per channel. Pay special attention to the gap between reported conversions in Google Ads and observed conversions in GA4 — this delta reveals the extent of view-through attribution inflation. - Deploy server-side tracking for accuracy. Browser-based tracking loses 15-25% of conversion data due to ad blockers and cookie restrictions. Implement server-side tagging via Google Tag Manager Server Container to capture the full picture. This is critical for PMax because the channels with the highest tracking loss (Display, YouTube) are often the ones with the most inflated performance metrics. Server-side tracking closes this gap and gives you ground truth for optimization decisions.
- Set up Looker Studio dashboards with channel-level CVR. Create automated dashboards that pull GA4 data and display post-click CVR, bounce rate, session duration, pages per session, and conversion value per PMax channel, updated daily. Include week-over-week trend lines so your team can spot degradation early. This single dashboard becomes your source of truth for PMax channel performance.
Solution 2: Build Channel-Specific Landing Experiences
Once you have visibility into which channels convert (and which do not), the next step is to create tailored post-click experiences for each traffic source:
- Create intent-matched landing pages for Search traffic. Search users have the highest intent. Your landing page should immediately address their query, feature a prominent CTA above the fold, and minimize distractions. Include trust signals (reviews, certifications, money-back guarantees) early in the page. According to Unbounce’s 2025 Conversion Benchmark Report, conversion-focused pages with a single CTA outperform multi-option pages by 27% for high-intent traffic. For Search traffic, speed matters especially — every 100ms of additional load time costs roughly 1.1% of conversions (Google/Deloitte 2024 study).
- Design video-to-page continuity for YouTube traffic. When a user clicks from a YouTube ad, they expect a seamless transition from the video experience. Embed the same video (or a condensed version) at the top of your landing page. Use messaging that mirrors the video script. Include a clear “watch the rest” CTA for users who clicked before the video ended. This continuity reduces bounce rates on YouTube-sourced traffic by 18-22% based on VidIQ research. Without it, users feel a jarring disconnect between the video ad and a text-heavy landing page, and they leave.
- Build scroll-optimized content pages for Discover and Gmail traffic. Users arriving from Discover and Gmail are in a browsing mindset, not a buying mindset. Instead of hard-selling, use editorial-style landing pages with content that educates and gradually introduces your product. Progressive CTAs — soft engagement first (download a guide, watch a demo), then harder conversion (start a trial, request a quote) — perform 35% better for feed-sourced traffic than direct-response pages. Structure these pages for mobile-first scrolling since over 80% of Discover traffic comes from mobile devices.
- Use dynamic content personalization based on traffic source. Tools like DeepClick allow you to dynamically adjust landing page elements based on the traffic source. Show different headlines, hero images, social proof elements, and CTA copy depending on whether the visitor arrived from Search, Display, YouTube, or Discover — all without creating entirely separate pages. This is especially valuable for advertisers managing post-click strategy across multiple ad platforms where each source demands different messaging but maintaining dozens of separate landing pages is impractical.
Solution 3: Implement Systematic Testing and Budget Feedback Loops
Optimization is not a one-time fix. You need a system that continuously improves channel-level CVR and feeds learnings back into budget allocation:
- Run A/B tests per channel segment, not in aggregate. Do not test landing pages against all traffic combined. Segment your tests by PMax channel. A headline that wins for Search traffic may lose for Display traffic because the user mindset is fundamentally different. Use GA4 audiences or your analytics platform to segment test results by traffic source, and make optimization decisions per channel, not in aggregate. This means running 3-4 parallel tests — one for each major PMax channel — rather than a single site-wide test.
- Set up automated alerts for CVR drops. Configure alerts in GA4 or your BI tool that fire when any PMax channel’s post-click CVR drops below a threshold (e.g., 20% below the 30-day rolling average). This catches issues fast — a landing page change might improve Search CVR but tank YouTube CVR, and you need to know immediately. Without alerts, these cross-channel impacts can go unnoticed for weeks.
- Use PMax asset group structure to influence channel allocation. While you cannot directly control PMax’s channel allocation, you can influence it through asset group design. Create separate asset groups with assets optimized for specific channels: one group with strong video assets (to attract YouTube and Discover inventory), another with high-converting search headlines and descriptions (to attract Search inventory), and a third with compelling display creative. Monitor each asset group’s channel distribution and pause groups that consistently attract budget to low-CVR channels.
- Feed post-click CVR data back into your bidding strategy. If you are using value-based bidding (tROAS), ensure your conversion values accurately reflect the true customer value from each channel. If Display conversions have a 40% lower lifetime value than Search conversions — which is common because Display captures more impulse-driven, lower-intent users — adjust your conversion values accordingly. This helps PMax’s algorithm make better channel allocation decisions by giving it accurate profitability signals rather than treating all conversions as equal.
- Implement weekly channel performance reviews. Schedule a 30-minute weekly review where you examine the Looker Studio dashboard, check for CVR anomalies per channel, review test results, and decide on reallocation actions. Document decisions and their outcomes over time. Advertisers who maintain this discipline consistently outperform those who check PMax performance only at the monthly level — Tinuiti’s 2025 benchmark found a 15% ROAS advantage for teams with weekly PMax optimization cadences.
Solution 4: Deploy Post-Click Recovery to Maximize Every Click
Even with optimized landing pages, some visitors will bounce — especially from PMax’s lower-intent channels. Post-click recovery extends the value of every click you pay for:
- Implement exit-intent offers tuned to channel behavior. Display and Discover traffic bounces faster, so trigger exit-intent overlays earlier (after 5-8 seconds of inactivity rather than 15-20 seconds). For Search traffic, use scroll-depth triggers instead (e.g., when a user has scrolled 60% of the page but has not clicked a CTA), since these users engage longer before making a decision. Tailor the exit offer to the channel: offer a content download for Discover bouncers, a limited-time discount for Search bouncers.
- Deploy retargeting sequences differentiated by original PMax channel. A user who bounced from a YouTube-sourced landing page needs a different retargeting approach than one who bounced from Search. Build separate retargeting audiences in Google Ads based on the landing page URL parameters you set up in Solution 1, and serve channel-appropriate follow-up creative. YouTube bouncers respond well to sequential video retargeting; Search bouncers respond better to text-based remarketing on the Search network.
- Use fallback page technology to recover otherwise lost clicks. Solutions like DeepClick’s Ad Fallback Pages capture visitors who would otherwise be completely lost — recovering an additional 10-20% of clicks that standard landing pages miss. This is especially valuable for PMax’s lower-intent channels (Display, Discover, Gmail) where bounce rates exceed 60% and traditional landing pages fail to engage users who arrived without strong purchase intent.
Summary and Action Checklist: Fix Your PMax Channel CVR in 2026
Google PMax is a powerful tool, but its black-box channel allocation means your post-click conversion rates likely vary by 3-5x across channels — and you may not even know it. The advertisers who win with PMax in 2026 are not the ones with the best creative or the biggest budgets. They are the ones who diagnose and fix the post-click experience per channel, turning PMax’s multi-channel reach into a compounding advantage rather than a hidden drain.
Here is your week-by-week action checklist:
- Week 1 — Gain Visibility: Implement ValueTrack parameters (
{network}and{placement}) and GA4 channel-level tracking. Set up a Looker Studio dashboard showing post-click CVR, bounce rate, and session duration per PMax channel. Deploy server-side tracking via GTM Server Container. - Week 2 — Diagnose the Gap: Audit your current post-click CVR by channel. Identify the channels with the biggest CVR gaps (typically Display and Discover vs. Search). Quantify the wasted spend by calculating what your CPA would be if budget shifted from the lowest-CVR channel to the highest.
- Week 3 — Build Channel-Specific Experiences: Create at least two channel-specific landing page variants — one for high-intent Search traffic (single CTA, trust signals above the fold, fast load time) and one for low-intent browsing traffic from Display/Discover (editorial style, progressive CTAs, mobile-first layout). For YouTube, add video continuity to your existing page.
- Week 4 — Launch Testing and Feedback Loops: Start A/B tests per channel segment. Set up automated CVR drop alerts in GA4. Restructure your PMax asset groups to influence channel allocation. Update conversion values in tROAS bidding to reflect true per-channel LTV.
- Ongoing — Optimize and Recover: Review channel-level CVR weekly. Iterate on landing page tests per channel. Deploy exit-intent recovery and post-click fallback pages for low-CVR channels. Feed results back into bidding and asset group strategy every two weeks.
The performance gap between PMax advertisers who optimize post-click per channel and those who treat PMax as a set-and-forget black box will only widen as Google continues to expand PMax’s inventory and automate more of the budget allocation. Start closing that gap today — your competitors already are.
One ad click, multiple no-review impressions — that’s the DeepClick return link.
DeepClick helps Meta advertisers recover lost clicks with Ad Fallback Pages (+10-20% clicks), reduce ad complaints by 80%, and unlock 5-15% more conversions — without going through ad review again.

留下评论